General visualizations of peak detection results
Source:R/XcmsExperiment-plotting.R
plotChromPeaks.RdplotChromPeaks plots the identified chromatographic
peaks from one file into the plane spanned by the retention time (x-axis)
and m/z (y-axis) dimension. Each chromatographic peak is plotted as a
rectangle representing its width in RT and m/z dimension.
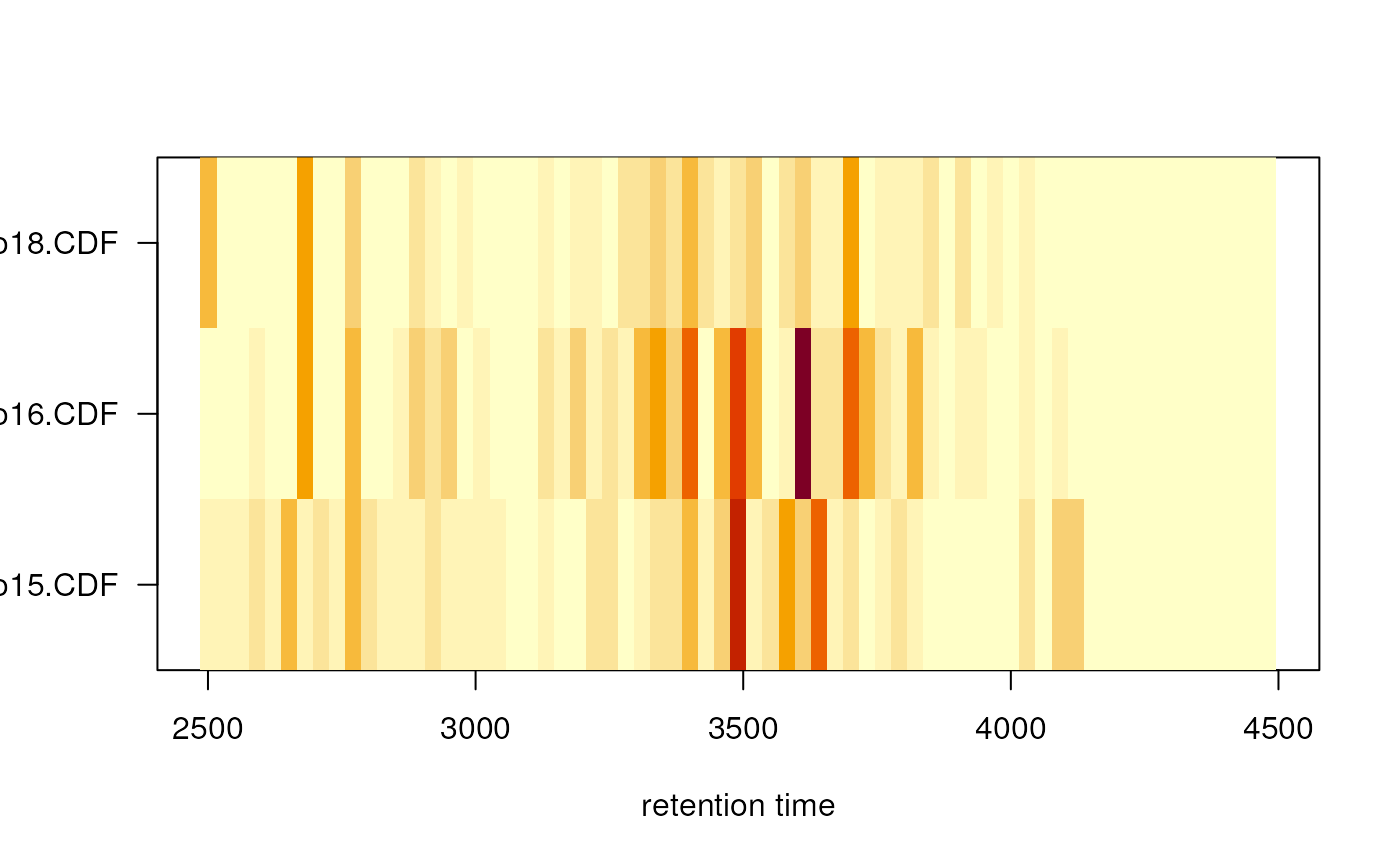
plotChromPeakImage plots the number of detected peaks for
each sample along the retention time axis as an image plot, i.e.
with the number of peaks detected in each bin along the retention time
represented with the color of the respective cell.
Usage
plotChromPeaks(
  x,
  file = 1,
  xlim = NULL,
  ylim = NULL,
  add = FALSE,
  border = "#00000060",
  col = NA,
  xlab = "retention time",
  ylab = "mz",
  main = NULL,
  msLevel = 1L,
  ...
)

plotChromPeakImage(
  x,
  binSize = 30,
  xlim = NULL,
  log = FALSE,
  xlab = "retention time",
  yaxt = par("yaxt"),
  main = "Chromatographic peak counts",
  msLevel = 1L,
  ...
)
Arguments
- x
A
XcmsExperiment()orXCMSnExp()object.- file
For
plotChromPeaks:integer(1)specifying the index of the file withinxfor which the plot should be created. Defaults tofile = 1.- xlim
numeric(2)specifying the x-axis limits (retention time dimension). Defaults toxlim = NULLin which case the full retention time range of the file is used.- ylim
For
plotChromPeaks:numeric(2)specifying the y-axis limits (m/z dimension). Defaults toylim = NULLin which case the full m/z range of the file is used.- add
For
plotChromPeaks:logical(1)whether the plot should be added to an existing plot or if a new plot should be created.- border
For
plotChromPeaks: the color for the rectangles' border.- col
For
plotChromPeaks: the color to be used to fill the rectangles.- xlab
character(1)defining the x-axis label.- ylab
For
plotChromPeaks:character(1)defining the y-axis label.- main
character(1)defining the plot title. By default (i.e.main = NULL) the name of the file will be used as title.- msLevel
integer(1)defining the MS level from which the peaks should be visualized.- ...
Additional arguments passed to the
plot(forplotChromPeaks) andimage(forplotChromPeakImage) functions. Ignored foradd = TRUE.- binSize
For
plotChromPeakImage:numeric(1)defining the size of the bins along the x-axis (retention time). Defaults tobinSize = 30, peaks within each 30 seconds will thus counted and plotted.- log
For
plotChromPeakImage:logical(1)whether the peak counts should be log2 transformed before plotting.- yaxt
For
plotChromPeakImage:character(1)defining whether y-axis labels should be added. To disable the y-axis useyaxt = "n". For any other value ofyaxtthe axis will be drawn. Seepar()help page for more details.
Details
The width and line type of the rectangles indicating the detected
chromatographic peaks for the plotChromPeaks function can be
specified using the par function, i.e. with par(lwd = 3)
and par(lty = 2), respectively.
Examples
## Load a test data set with detected peaks
faahko_sub <- loadXcmsData("faahko_sub2")
## plotChromPeakImage: plot an image for the identified peaks per file
plotChromPeakImage(faahko_sub)
 ## Show all detected chromatographic peaks from the first file
plotChromPeaks(faahko_sub)
## Show all detected chromatographic peaks from the first file
plotChromPeaks(faahko_sub)
 ## Plot all detected peaks from the second file and restrict the plot to a
## mz-rt slice
plotChromPeaks(faahko_sub, file = 2, xlim = c(3500, 3600), ylim = c(400, 600))
## Plot all detected peaks from the second file and restrict the plot to a
## mz-rt slice
plotChromPeaks(faahko_sub, file = 2, xlim = c(3500, 3600), ylim = c(400, 600))
