Extract an ion chromatogram for each chromatographic peak
Source:R/AllGenerics.R, R/XcmsExperiment.R
chromPeakChromatograms.RdExtract an ion chromatogram (EIC) for each chromatographic peak in an
XcmsExperiment() object. Parameters expandRt and expandMz allow to
increase the retention time and/or m/z boundaries of each chromatographic
peak. Parameter return.type allows to define the format in which the
chromatograms are returned:
return.type = "Chromatograms": return the EICs as aChromatograms::Chromatograms()object. The ID of the chromatographic peak can be accessed with$chrom_peak_idfrom the returned object.return.type = "MChromatograms": return the EICs as a (single column) legacy MSnbase::MChromatograms object.return.type = "XChromatograms": return the EICs as a (single column) legacyXChromatograms()object which contains also the information of all chromatographic peaks.
Arguments
- object
An
XcmsExperiment()with identified chromatographic peaks.- ...
currently ignored.
- expandRt
numeric(1)to eventually expand the retention time range from which the signal should be integrated. The chromatogram will contain signal fromchromPeaks[, "rtmin"] - expandRttochromPeaks[, "rtmax"] + expandRt. The default isexpandRt = 0.- expandMz
numeric(1)to eventually expand the m/z range from which the signal should be integrated. The chromatogram will contain signal fromchromPeaks[, "mzmin"] - expandMztochromPeaks[, "mzmax"] + expandMz. The default isexpandMz = 0.- aggregationFun
character(1)defining the function how signals within the m/z range in each spectrum (i.e. for each discrete retention time) should be aggregated. The default (aggregationFun = "max") reports the largest signal for each spectrum.- peaks
optional
characterproviding the IDs of the chromatographic peaks (i.e. the row names of the peaks inchromPeaks(object)) for which chromatograms should be returned.- return.type
character(1)specifying the type of the returned object. Can be eitherreturn.type = "XChromatograms"(the default),return.type = "MChromatograms"orreturn.type = "Chromatograms".- progressbar
logical(1)whether the progress of the extraction process should be displayed.
See also
featureChromatograms() to extract an EIC for each feature.
Examples
## Load a test data set with detected peaks
library(xcms)
library(MsExperiment)
faahko_sub <- loadXcmsData("faahko_sub2")
## Extract EICs for all chromatographic peaks
library(Chromatograms)
chrs <- chromPeakChromatograms(faahko_sub, return.type = "Chromatograms")
chrs
#> Chromatographic data (Chromatograms) with 248 chromatograms in a ChromBackendSpectra backend:
#> chromIndex msLevel mz
#> CP001 NA 1 NA
#> CP002 NA 1 NA
#> CP003 NA 1 NA
#> CP004 NA 1 NA
#> CP005 NA 1 NA
#> CP006 NA 1 NA
#> ... 14 more chromatogram variables/columns
#> ... 2 peaksData variables
#>
#> The Spectra object contains 3161 spectra
## Get the chrom peak ID of all EICs
chrs$chrom_peak_id
#> [1] "CP001" "CP002" "CP003" "CP004" "CP005" "CP006" "CP007" "CP008" "CP009"
#> [10] "CP010" "CP011" "CP012" "CP013" "CP014" "CP015" "CP016" "CP017" "CP018"
#> [19] "CP019" "CP020" "CP021" "CP022" "CP023" "CP024" "CP025" "CP026" "CP027"
#> [28] "CP028" "CP029" "CP030" "CP031" "CP032" "CP033" "CP034" "CP035" "CP036"
#> [37] "CP037" "CP038" "CP039" "CP040" "CP041" "CP042" "CP043" "CP044" "CP045"
#> [46] "CP046" "CP047" "CP048" "CP049" "CP050" "CP051" "CP052" "CP053" "CP054"
#> [55] "CP055" "CP056" "CP057" "CP058" "CP059" "CP060" "CP061" "CP062" "CP063"
#> [64] "CP064" "CP065" "CP066" "CP067" "CP068" "CP069" "CP070" "CP071" "CP072"
#> [73] "CP073" "CP074" "CP075" "CP076" "CP077" "CP078" "CP079" "CP080" "CP081"
#> [82] "CP082" "CP083" "CP084" "CP085" "CP086" "CP087" "CP088" "CP089" "CP090"
#> [91] "CP091" "CP092" "CP093" "CP094" "CP095" "CP096" "CP097" "CP098" "CP099"
#> [100] "CP100" "CP101" "CP102" "CP103" "CP104" "CP105" "CP106" "CP107" "CP108"
#> [109] "CP109" "CP110" "CP111" "CP112" "CP113" "CP114" "CP115" "CP116" "CP117"
#> [118] "CP118" "CP119" "CP120" "CP121" "CP122" "CP123" "CP124" "CP125" "CP126"
#> [127] "CP127" "CP128" "CP129" "CP130" "CP131" "CP132" "CP133" "CP134" "CP135"
#> [136] "CP136" "CP137" "CP138" "CP139" "CP140" "CP141" "CP142" "CP143" "CP144"
#> [145] "CP145" "CP146" "CP147" "CP148" "CP149" "CP150" "CP151" "CP152" "CP153"
#> [154] "CP154" "CP155" "CP156" "CP157" "CP158" "CP159" "CP160" "CP161" "CP162"
#> [163] "CP163" "CP164" "CP165" "CP166" "CP167" "CP168" "CP169" "CP170" "CP171"
#> [172] "CP172" "CP173" "CP174" "CP175" "CP176" "CP177" "CP178" "CP179" "CP180"
#> [181] "CP181" "CP182" "CP183" "CP184" "CP185" "CP186" "CP187" "CP188" "CP189"
#> [190] "CP190" "CP191" "CP192" "CP193" "CP194" "CP195" "CP196" "CP197" "CP198"
#> [199] "CP199" "CP200" "CP201" "CP202" "CP203" "CP204" "CP205" "CP206" "CP207"
#> [208] "CP208" "CP209" "CP210" "CP211" "CP212" "CP213" "CP214" "CP215" "CP216"
#> [217] "CP217" "CP218" "CP219" "CP220" "CP221" "CP222" "CP223" "CP224" "CP225"
#> [226] "CP226" "CP227" "CP228" "CP229" "CP230" "CP231" "CP232" "CP233" "CP234"
#> [235] "CP235" "CP236" "CP237" "CP238" "CP239" "CP240" "CP241" "CP242" "CP243"
#> [244] "CP244" "CP245" "CP246" "CP247" "CP248"
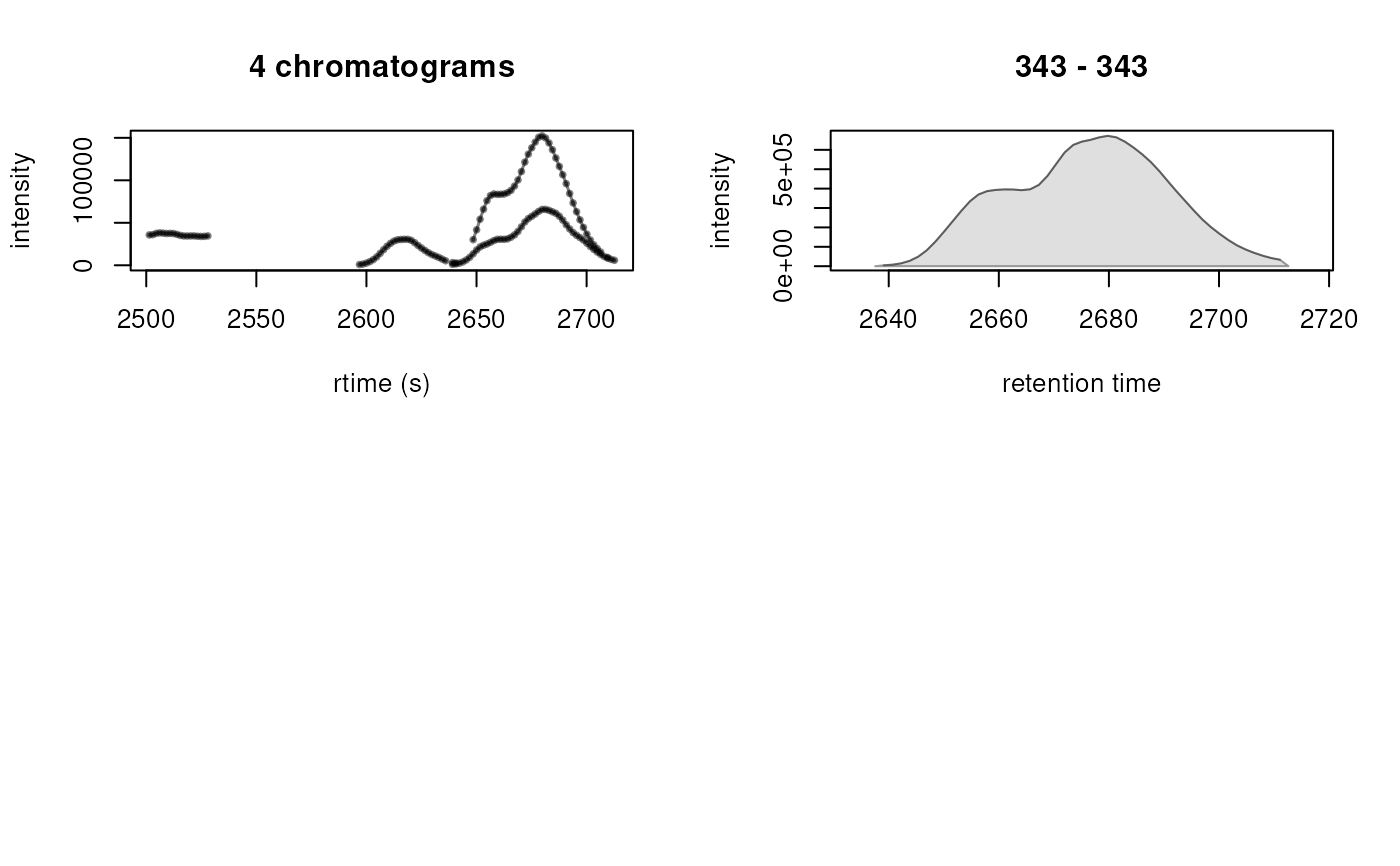
## Plot the first 4 EICs
plotChromatograms(chrs[1:4])
 ## Plot the first 4 EICs into the same plot
plotChromatogramsOverlay(chrs[1:4])
## Use the legacy EIC infrastructure (MChromatograms, XChromatograms)
library(MSnbase)
## Get EICs for every detected chromatographic peak
chrs <- chromPeakChromatograms(faahko_sub)
chrs
#> XChromatograms with 248 rows and 1 column
#> [,1]
#> <XChromatogram>
#> [1,] peaks: 1
#> [2,] peaks: 1
#> ... ...
#> [247,] peaks: 1
#> [248,] peaks: 1
#> phenoData with 2 variables
#> featureData with 5 variables
#> - - - xcms preprocessing - - -
#> Chromatographic peak detection:
#> method: centWave
## Order of EICs matches the order in chromPeaks
chromPeaks(faahko_sub) |> head()
#> mz mzmin mzmax rt rtmin rtmax into intb maxo
#> CP001 453.2 453.2 453.2 2506.073 2501.378 2527.982 1007409.0 1007380.8 38152
#> CP002 302.0 302.0 302.0 2617.185 2595.275 2640.659 687146.6 671297.8 30552
#> CP003 344.0 344.0 344.0 2679.783 2646.919 2709.517 5210015.9 5135916.9 152320
#> CP004 430.1 430.1 430.1 2681.348 2639.094 2712.647 2395840.3 2299899.6 65752
#> CP005 366.0 366.0 366.0 2679.783 2642.224 2718.907 3365174.0 3279468.3 79928
#> CP006 343.0 343.0 343.0 2678.218 2637.529 2712.647 24147443.2 23703761.7 672064
#> sn sample
#> CP001 38151 1
#> CP002 46 1
#> CP003 68 1
#> CP004 42 1
#> CP005 49 1
#> CP006 87 1
## variable "sample_index" provides the index of the sample the EIC was
## extracted from
fData(chrs)$sample_index
#> [1] 1 1 1 1 1 1 1 1 1 1 1 1 1 1 1 1 1 1 1 1 1 1 1 1 1 1 1 1 1 1 1 1 1 1 1 1 1
#> [38] 1 1 1 1 1 1 1 1 1 1 1 1 1 1 1 1 1 1 1 1 1 1 1 1 1 1 1 1 1 1 1 1 1 1 1 1 1
#> [75] 1 1 1 1 1 1 1 1 1 1 1 1 1 2 2 2 2 2 2 2 2 2 2 2 2 2 2 2 2 2 2 2 2 2 2 2 2
#> [112] 2 2 2 2 2 2 2 2 2 2 2 2 2 2 2 2 2 2 2 2 2 2 2 2 2 2 2 2 2 2 2 2 2 2 2 2 2
#> [149] 2 2 2 2 2 2 2 2 2 2 2 2 2 2 2 2 2 2 2 2 2 2 2 2 2 2 2 2 2 2 2 2 2 2 2 2 2
#> [186] 2 2 3 3 3 3 3 3 3 3 3 3 3 3 3 3 3 3 3 3 3 3 3 3 3 3 3 3 3 3 3 3 3 3 3 3 3
#> [223] 3 3 3 3 3 3 3 3 3 3 3 3 3 3 3 3 3 3 3 3 3 3 3 3 3 3
## Get the EIC for selected peaks only.
pks <- rownames(chromPeaks(faahko_sub))[c(6, 12)]
pks
#> [1] "CP006" "CP012"
## Expand the data on retention time dimension by 15 seconds (on each side)
res <- chromPeakChromatograms(faahko_sub, peaks = pks, expandRt = 5)
plot(res[1, ])
## Plot the first 4 EICs into the same plot
plotChromatogramsOverlay(chrs[1:4])
## Use the legacy EIC infrastructure (MChromatograms, XChromatograms)
library(MSnbase)
## Get EICs for every detected chromatographic peak
chrs <- chromPeakChromatograms(faahko_sub)
chrs
#> XChromatograms with 248 rows and 1 column
#> [,1]
#> <XChromatogram>
#> [1,] peaks: 1
#> [2,] peaks: 1
#> ... ...
#> [247,] peaks: 1
#> [248,] peaks: 1
#> phenoData with 2 variables
#> featureData with 5 variables
#> - - - xcms preprocessing - - -
#> Chromatographic peak detection:
#> method: centWave
## Order of EICs matches the order in chromPeaks
chromPeaks(faahko_sub) |> head()
#> mz mzmin mzmax rt rtmin rtmax into intb maxo
#> CP001 453.2 453.2 453.2 2506.073 2501.378 2527.982 1007409.0 1007380.8 38152
#> CP002 302.0 302.0 302.0 2617.185 2595.275 2640.659 687146.6 671297.8 30552
#> CP003 344.0 344.0 344.0 2679.783 2646.919 2709.517 5210015.9 5135916.9 152320
#> CP004 430.1 430.1 430.1 2681.348 2639.094 2712.647 2395840.3 2299899.6 65752
#> CP005 366.0 366.0 366.0 2679.783 2642.224 2718.907 3365174.0 3279468.3 79928
#> CP006 343.0 343.0 343.0 2678.218 2637.529 2712.647 24147443.2 23703761.7 672064
#> sn sample
#> CP001 38151 1
#> CP002 46 1
#> CP003 68 1
#> CP004 42 1
#> CP005 49 1
#> CP006 87 1
## variable "sample_index" provides the index of the sample the EIC was
## extracted from
fData(chrs)$sample_index
#> [1] 1 1 1 1 1 1 1 1 1 1 1 1 1 1 1 1 1 1 1 1 1 1 1 1 1 1 1 1 1 1 1 1 1 1 1 1 1
#> [38] 1 1 1 1 1 1 1 1 1 1 1 1 1 1 1 1 1 1 1 1 1 1 1 1 1 1 1 1 1 1 1 1 1 1 1 1 1
#> [75] 1 1 1 1 1 1 1 1 1 1 1 1 1 2 2 2 2 2 2 2 2 2 2 2 2 2 2 2 2 2 2 2 2 2 2 2 2
#> [112] 2 2 2 2 2 2 2 2 2 2 2 2 2 2 2 2 2 2 2 2 2 2 2 2 2 2 2 2 2 2 2 2 2 2 2 2 2
#> [149] 2 2 2 2 2 2 2 2 2 2 2 2 2 2 2 2 2 2 2 2 2 2 2 2 2 2 2 2 2 2 2 2 2 2 2 2 2
#> [186] 2 2 3 3 3 3 3 3 3 3 3 3 3 3 3 3 3 3 3 3 3 3 3 3 3 3 3 3 3 3 3 3 3 3 3 3 3
#> [223] 3 3 3 3 3 3 3 3 3 3 3 3 3 3 3 3 3 3 3 3 3 3 3 3 3 3
## Get the EIC for selected peaks only.
pks <- rownames(chromPeaks(faahko_sub))[c(6, 12)]
pks
#> [1] "CP006" "CP012"
## Expand the data on retention time dimension by 15 seconds (on each side)
res <- chromPeakChromatograms(faahko_sub, peaks = pks, expandRt = 5)
plot(res[1, ])