
Extract ion chromatograms for each feature
Source:R/AllGenerics.R, R/XcmsExperiment.R, R/methods-XCMSnExp.R
featureChromatograms.RdfeatureChromatograms() extracts ion chromatograms for features in an
XcmsExperiment or XCMSnExp object. The function returns for each
feature the extracted ion chromatograms in each sample. Based on the setting
for parameter return.type the results are returned as a legacy
MSnbase::MChromatograms or XChromatograms() object
(return.type = "MChromatograms" or return.type = "XChromatograms", the
default) or as a new Chromatograms::Chromatograms() object
(return.type = "Chromatograms"):
return.type = "MChromatograms": the chromatograms are extracted from the m/z - rt region that includes all chromatographic peaks for a feature. ThefeatureArea()function is used to define this region which is defined using the range of the chromatographic peaks' m/z and retention times. TheMChromatogramsorganizes the EICs per feature, i.e., each row in the returnedMChromatogramscorresponds to one feature with columns containing EICs per sample.return.type = "XChromatograms": chromatographic data is defined as forreturn.type = "MChromatograms", but the returned EICs contain in addition also the information on the individual chromatographic peaks as well as the feature definitions. Forobjectbeing anXCMSnExpobject, parameterincludeallows also to return all chromatographic peaks with their apex position within the selected region (include = "apex_within") or any chromatographic peak overlapping the m/z and retention time range (include = "any").return.type = "Chromatograms": the EICs, defined throughfeatureArea()as described above, are returned as aChromatograms()object which organizes chromatograms sequentially in a list-like structure: first all chromatograms for the first feature in all samples, then those from the second feature and so on. See examples for details. The feature ID is stored in the result object's$feature_idvariable. By default, the returned EICs represent the chromatograms of thefeatureArea(), but withfeatureArea = FALSEeach returned chromatogram represents the EIC for the actual area of the individual chromatographic peaks assigned to the feature (same as withchromPeakChromatograms()). The IDs of the chromatographic peaks can then be accessed through$chrom_peak_id.
Usage
featureChromatograms(object, ...)

# S4 method for class 'XcmsExperiment'
featureChromatograms(
  object,
  expandRt = 0,
  expandMz = 0,
  aggregationFun = "max",
  features = character(),
  return.type = c("XChromatograms", "MChromatograms", "Chromatograms"),
  chunkSize = 2L,
  mzmin = min,
  mzmax = max,
  rtmin = min,
  rtmax = max,
  featureArea = TRUE,
  ...,
  progressbar = TRUE,
  BPPARAM = bpparam()
)

# S4 method for class 'XCMSnExp'
featureChromatograms(
  object,
  expandRt = 0,
  aggregationFun = "max",
  features,
  include = c("feature_only", "apex_within", "any", "all"),
  filled = FALSE,
  n = length(fileNames(object)),
  value = c("maxo", "into"),
  expandMz = 0,
  ...
)
Arguments
- object
XcmsExperimentorXCMSnExpobject with grouped chromatographic peaks.- ...
optional arguments to be passed along to the
chromatogram()function.- expandRt
numeric(1)to expand the retention time range for each chromatographic peak by a constant value on each side.- expandMz
numeric(1)to expand the m/z range for each chromatographic peak by a constant value on each side. Be aware that by extending the m/z range the extracted EIC might no longer represent the actual identified chromatographic peak because intensities of potential additional mass peaks within each spectra would be aggregated into the final reported intensity value per spectrum (retention time).- aggregationFun
character(1)specifying the name that should be used to aggregate intensity values across the m/z value range for the same retention time. The default"max"returns a base peak chromatogram.- features
integer,characterorlogicaldefining a subset of features for which chromatograms should be returned. Can be the index of the features infeatureDefinitions, feature IDs (row names offeatureDefinitions) or a logical vector.- return.type
character(1)defining how the result should be returned. Supported arereturn.type = "XChromatograms"(the default),return.type = "MChromatograms"andreturn.type = "Chromatograms". See function descriptions for details.- chunkSize
For
objectbeing anXcmsExperiment:integer(1)defining the number of files from which the data should be loaded at a time into memory. Defaults tochunkSize = 2L.- mzmin
functiondefining how the lower boundary of the m/z region from which the EIC is integrated should be defined. Defaults tomzmin = minthus the smallest"mzmin"value for all chromatographic peaks of a feature will be used.- mzmax
functiondefining how the upper boundary of the m/z region from which the EIC is integrated should be defined. Defaults tomzmax = maxthus the largest"mzmax"value for all chromatographic peaks of a feature will be used.- rtmin
functiondefining how the lower boundary of the rt region from which the EIC is integrated should be defined. Defaults tortmin = minthus the smallest"rtmin"value for all chromatographic peaks of a feature will be used.- rtmax
functiondefining how the upper boundary of the rt region from which the EIC is integrated should be defined. Defaults tortmax = maxthus the largest"rtmax"value for all chromatographic peaks of a feature will be used.- featureArea
For
objectbeing aXcmsExperimentandreturn.type = FALSE: return EICs representing data within the identified chromatographic peaks.- progressbar
logical(1)defining whether a progress bar is shown.- BPPARAM
For
objectbeing anXcmsExperiment: parallel processing setup. Defaults toBPPARAM = bpparam(). SeeBiocParallel::bpparam()for more information.- include
Only for
objectbeing anXCMSnExp:character(1)defining which chromatographic peaks (and related feature definitions) should be included in the returnedXChromatograms(). Defaults to"feature_only"; See description above for options and details.- filled
Only for
objectbeing anXCMSnExp:logical(1)whether filled-in peaks should be included in the result object. The default isfilled = FALSE, i.e. only detected peaks are reported.- n
Only for
objectbeing anXCMSnExp:integer(1)to optionally specify the number of top n samples from which the EIC should be extracted.- value
Only for
objectbeing anXCMSnExp:character(1)specifying the column to be used to sort the samples. Can be either"maxo"(the default) or"into"to use the maximal peak intensity or the integrated peak area, respectively.
Value
Depending on parameter return.type, a MSnbase::MChromatograms,
XChromatograms or Chromatograms::Chromatograms() object. See function
description above for details.
Note
Some of the functionality available for XChromatograms objects is not
yet available for Chromatograms. Thus, while the newer
Chromatograms-based infrastructure is more efficient and powerful, for
some operations it is suggested to still use the legacy objects (such as
simulating a correspondence analysis through plotChromPeakDensity()).
By default the EIC data of a feature is extracted from every sample using
the same m/z - rt area. Unless featureArea = FALSE is used, the EIC in a
sample does thus not exactly represent the signal of the actually identified
chromatographic peak in that sample.
Parameters include, filled, n and value are only supported
for object being an XCMSnExp.
Parameter featureArea is only supported for
return.type = "Chromatograms".
When extracting EICs from only the top n samples it can happen that one
or more of the features specified with features are dropped because they
have no detected peak in the top n samples. The chance for this to happen
is smaller if x contains also filled-in peaks (with fillChromPeaks).
See also
filterColumnsKeepTop() to filter the extracted EICs keeping only
the top n columns (samples) with the highest intensity.
chromPeakChromatograms() for a function to extract an EIC for each
chromatographic peak.
Examples
## Load a test data set with detected peaks
library(xcms)
library(MsExperiment)
faahko_sub <- loadXcmsData("faahko_sub2")
## Disable parallel processing for this example
register(SerialParam())
## Perform correspondence analysis
xdata <- groupChromPeaks(faahko_sub,
param = PeakDensityParam(minFraction = 0.8, sampleGroups = rep(1, 3)))
## Get the feature definitions
featureDefinitions(xdata)
#> mzmed mzmin mzmax rtmed rtmin rtmax npeaks 1 peakidx
#> FT01 300.2 300.2 300.2 3387.143 3379.317 3390.271 4 3 35, 125,....
#> FT02 301.0 301.0 301.0 2787.766 2786.200 2792.459 3 3 10, 97, 198
#> FT03 326.2 326.2 326.2 3416.877 3415.311 3424.700 3 3 37, 128, 213
#> FT04 328.2 328.2 328.2 3626.581 3618.755 3631.274 3 3 64, 159, 231
#> FT05 329.2 329.2 329.2 3626.581 3618.755 3631.274 3 3 63, 156, 230
#> FT06 343.0 343.0 343.0 2684.479 2678.218 2686.042 3 3 6, 92, 195
#> FT07 344.0 344.0 344.0 2682.914 2679.783 2686.042 3 3 3, 90, 193
#> FT08 354.2 354.2 354.2 3614.061 3610.930 3621.884 3 3 56, 153, 228
#> FT09 356.2 356.2 356.2 3830.025 3819.069 3833.153 3 3 78, 180, 241
#> FT10 365.0 365.0 365.0 2684.479 2679.783 2686.042 3 3 7, 93, 196
#> FT11 438.3 438.3 438.3 4052.248 4047.552 4060.071 3 3 81, 186, 248
#> FT12 496.2 496.2 496.2 3335.498 3316.719 3340.194 3 3 47, 143, 220
#> FT13 496.2 496.2 496.2 3402.791 3384.012 3410.617 3 3 48, 144, 221
#> FT14 508.2 508.2 508.2 3524.859 3515.468 3529.552 3 3 67, 163, 232
#> FT15 509.2 509.2 509.2 3523.294 3512.338 3531.117 3 3 54, 160, 229
#> FT16 522.2 522.2 522.2 3387.142 3344.888 3434.091 6 3 52, 53, ....
#> FT17 523.2 523.2 523.2 3387.142 3344.888 3434.091 6 3 38, 39, ....
#> FT18 524.2 524.2 524.2 3676.658 3598.410 3704.828 4 3 74, 75, ....
#> FT19 525.2 525.2 525.2 3690.742 3662.574 3706.393 3 3 72, 173, 238
#> FT20 532.2 532.2 532.2 3482.605 3476.344 3488.863 3 3 49, 137, 219
#> FT21 536.2 536.2 536.2 3712.653 3703.262 3718.912 3 3 73, 174, 237
#> ms_level
#> FT01 1
#> FT02 1
#> FT03 1
#> FT04 1
#> FT05 1
#> FT06 1
#> FT07 1
#> FT08 1
#> FT09 1
#> FT10 1
#> FT11 1
#> FT12 1
#> FT13 1
#> FT14 1
#> FT15 1
#> FT16 1
#> FT17 1
#> FT18 1
#> FT19 1
#> FT20 1
#> FT21 1
#############################################################################
## Extracting the feature's EICs as an `Chromatograms` object
## Define the IDs for selected features from which to extract the data
fids <- rownames(featureDefinitions(xdata))[1:3]
chrs <- featureChromatograms(xdata, features = fids,
return.type = "Chromatograms")
chrs
#> Chromatographic data (Chromatograms) with 9 chromatograms in a ChromBackendSpectra backend:
#> chromIndex msLevel mz
#> 1 NA 1 NA
#> 2 NA 1 NA
#> 3 NA 1 NA
#> 4 NA 1 NA
#> 5 NA 1 NA
#> 6 NA 1 NA
#> ... 14 more chromatogram variables/columns
#> ... 2 peaksData variables
#>
#> The Spectra object contains 1313 spectra
## The data is organized by feature and sample: first all EICs for the first
## feature in all samples, then those from the second etc
chrs$feature_id
#> [1] "FT01" "FT01" "FT01" "FT02" "FT02" "FT02" "FT03" "FT03" "FT03"
## The sample information is stored in the object's `$dataOrigin`
basename(chrs$dataOrigin)
#> [1] "ko15.CDF" "ko16.CDF" "ko18.CDF" "ko15.CDF" "ko16.CDF" "ko18.CDF" "ko15.CDF"
#> [8] "ko16.CDF" "ko18.CDF"
## Plot the data for the first feature
library(Chromatograms)
## Separately
plotChromatograms(chrs[chrs$feature_id == fids[1]])
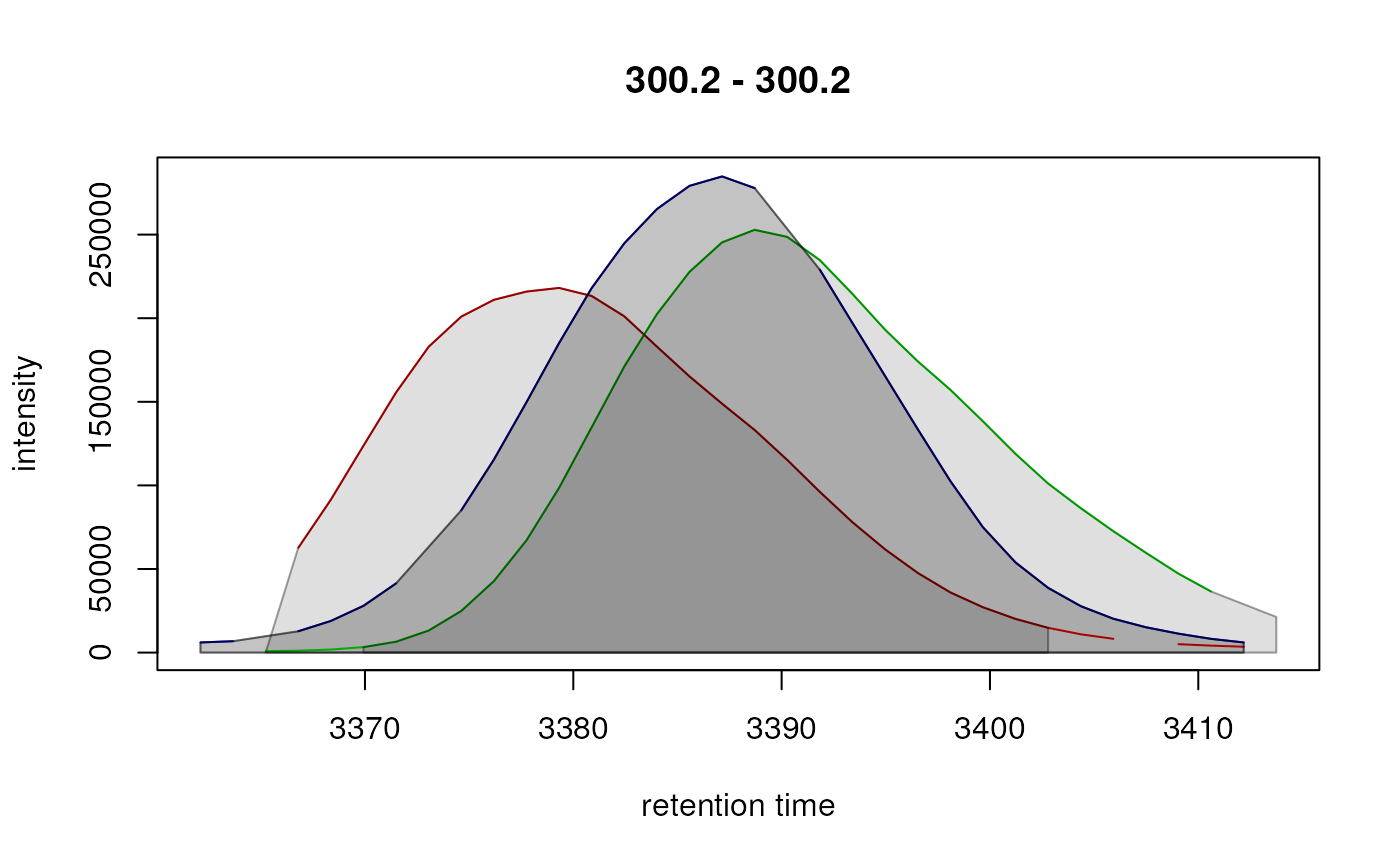 ## In a single plot
plotChromatogramsOverlay(chrs[chrs$feature_id == fids[1]])
## Extract the EICs for the individual chromatographic peaks associated to
## each feature:
chrs <- featureChromatograms(xdata, features = fids,
return.type = "Chromatograms", featureArea = FALSE)
chrs
#> Chromatographic data (Chromatograms) with 10 chromatograms in a ChromBackendSpectra backend:
#> chromIndex msLevel mz
#> CP035 NA 1 NA
#> CP125 NA 1 NA
#> CP210 NA 1 NA
#> CP212 NA 1 NA
#> CP010 NA 1 NA
#> CP097 NA 1 NA
#> ... 15 more chromatogram variables/columns
#> ... 2 peaksData variables
#>
#> The Spectra object contains 1313 spectra
## In contrast to `featureArea = TRUE`, where one (and only one) EIC per
## sample is guaranteed, for `featureArea = FALSE` there can be more than
## one chromatogram per sample (or no chromatogram per sample), representing
## exactly the association between identified chromatographic peaks and
## features
chrs$feature_id
#> [1] "FT01" "FT01" "FT01" "FT01" "FT02" "FT02" "FT02" "FT03" "FT03" "FT03"
chrs$chrom_peak_id
#> [1] "CP035" "CP125" "CP210" "CP212" "CP010" "CP097" "CP198" "CP037" "CP128"
#> [10] "CP213"
#############################################################################
## Using the legacy `MChromatogtrams`/`XChromatograms`
## Extract ion chromatograms for the first 3 features. Parameter
## `features` can be either the feature IDs or feature indices.
chrs <- featureChromatograms(xdata, features = fids)
#> Processing chromatographic peaks for features
## Plot the EIC for the first feature using different colors for each file.
plot(chrs[1, ], col = c("red", "green", "blue"))
## The EICs for all 3 samples use the same m/z and retention time range,
## which was defined using the `featureArea` function:
featureArea(xdata, features = rownames(featureDefinitions(xdata))[1:3],
mzmin = min, mzmax = max, rtmin = min, rtmax = max)
#> mzmin mzmax rtmin rtmax
#> FT01 300.2 300.2 3362.104 3413.746
#> FT02 301.0 301.0 2765.855 2820.630
#> FT03 326.2 326.2 3391.837 3449.740
## To extract the actual (exact) EICs for each chromatographic peak of
## a feature in each sample, the `chromPeakChromatograms` function would
## need to be used instead. Below we extract the EICs for all
## chromatographic peaks of the first feature. We need to first get the
## IDs of all chromatographic peaks assigned to the first feature:
peak_ids <- rownames(chromPeaks(xdata))[featureDefinitions(xdata)$peakidx[[1L]]]
## We can now pass these to the `chromPeakChromatograms` function with
## parameter `peaks`:
eic_1 <- chromPeakChromatograms(xdata, peaks = peak_ids)
## To plot these into a single plot we need to use the
## `plotChromatogramsOverlay` function:
plotChromatogramsOverlay(eic_1)
## In a single plot
plotChromatogramsOverlay(chrs[chrs$feature_id == fids[1]])
## Extract the EICs for the individual chromatographic peaks associated to
## each feature:
chrs <- featureChromatograms(xdata, features = fids,
return.type = "Chromatograms", featureArea = FALSE)
chrs
#> Chromatographic data (Chromatograms) with 10 chromatograms in a ChromBackendSpectra backend:
#> chromIndex msLevel mz
#> CP035 NA 1 NA
#> CP125 NA 1 NA
#> CP210 NA 1 NA
#> CP212 NA 1 NA
#> CP010 NA 1 NA
#> CP097 NA 1 NA
#> ... 15 more chromatogram variables/columns
#> ... 2 peaksData variables
#>
#> The Spectra object contains 1313 spectra
## In contrast to `featureArea = TRUE`, where one (and only one) EIC per
## sample is guaranteed, for `featureArea = FALSE` there can be more than
## one chromatogram per sample (or no chromatogram per sample), representing
## exactly the association between identified chromatographic peaks and
## features
chrs$feature_id
#> [1] "FT01" "FT01" "FT01" "FT01" "FT02" "FT02" "FT02" "FT03" "FT03" "FT03"
chrs$chrom_peak_id
#> [1] "CP035" "CP125" "CP210" "CP212" "CP010" "CP097" "CP198" "CP037" "CP128"
#> [10] "CP213"
#############################################################################
## Using the legacy `MChromatogtrams`/`XChromatograms`
## Extract ion chromatograms for the first 3 features. Parameter
## `features` can be either the feature IDs or feature indices.
chrs <- featureChromatograms(xdata, features = fids)
#> Processing chromatographic peaks for features
## Plot the EIC for the first feature using different colors for each file.
plot(chrs[1, ], col = c("red", "green", "blue"))
## The EICs for all 3 samples use the same m/z and retention time range,
## which was defined using the `featureArea` function:
featureArea(xdata, features = rownames(featureDefinitions(xdata))[1:3],
mzmin = min, mzmax = max, rtmin = min, rtmax = max)
#> mzmin mzmax rtmin rtmax
#> FT01 300.2 300.2 3362.104 3413.746
#> FT02 301.0 301.0 2765.855 2820.630
#> FT03 326.2 326.2 3391.837 3449.740
## To extract the actual (exact) EICs for each chromatographic peak of
## a feature in each sample, the `chromPeakChromatograms` function would
## need to be used instead. Below we extract the EICs for all
## chromatographic peaks of the first feature. We need to first get the
## IDs of all chromatographic peaks assigned to the first feature:
peak_ids <- rownames(chromPeaks(xdata))[featureDefinitions(xdata)$peakidx[[1L]]]
## We can now pass these to the `chromPeakChromatograms` function with
## parameter `peaks`:
eic_1 <- chromPeakChromatograms(xdata, peaks = peak_ids)
## To plot these into a single plot we need to use the
## `plotChromatogramsOverlay` function:
plotChromatogramsOverlay(eic_1)